
Work / Industrial forecasting
Quality forecasts before the lab result
On a continuous production line, the lab result for each unit arrives about 50 minutes after the unit is made. We built a system that forecasts that result from the line's own process data, so the people running the line can see where quality is heading while they wait. Engineers call this a soft sensor, or virtual metrology. The client and its process are confidential.
The approach applies to any line that records its process inputs and measures a result later: continuous process plants, food and beverage, packaging, metals and textiles are examples. It fits batch production as well as continuous lines.
- Status
- In operation at the client plant since September 2026
- Client
- Confidential
- Runs on
- One Windows PC at the plant, no internet connection
- Updated
- 11 Nov 2026
The problem
Units from the line go to the lab, which measures a full quality profile on each one. The result comes back the better part of an hour later.
The line does not stop while it waits. If a setting drifts, every unit made after the drift is made the same way, and nobody sees it until the lab result arrives. A correction made on a late result can only be checked by the next late result.
The gap matters most at a changeover, when the line moves to a new product or new settings. Until the first result for the new settings comes back, every lab result describes the line as it was before the change.
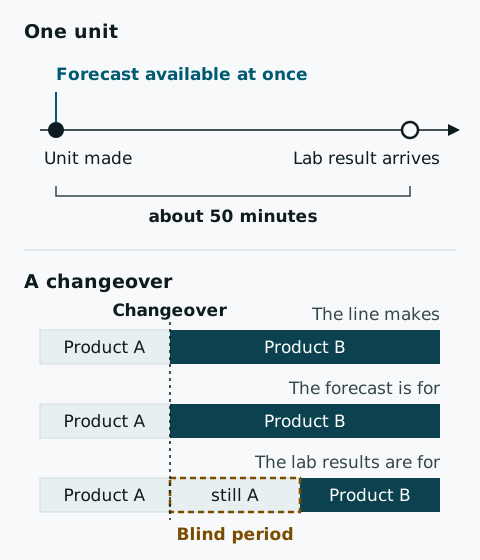
The line already records what drives quality: more than a thousand process inputs. We were asked whether those inputs are enough to forecast the lab result.
What we built
A decision-support system for the line. It reads the process inputs and forecasts the lab result for each unit before the lab has measured it. It gives the forecast for several points ahead in time, so the team sees the units being made now and the ones still to come. It forecasts and it can recommend; the people running the line decide. Operators work with it on the line. It is not wired to the line's controls.
| Item | Detail |
|---|---|
| Inputs | The process inputs the line records |
| Output | Each unit's full quality profile: every measurement the lab takes |
| Forecasts | Several points ahead in time, each a full quality profile |
| Models | Our own forecasting models, trained on this line's records; they include neural sequence models |
| Training data | Hundreds of thousands of units across many products, about two years of production |
The forecast covers every measurement the lab will take, so the team can see which one is drifting. A single pass or fail number would not show that.
How it runs
- It is delivered as a self-contained application on one standard Windows PC at the plant, with no internet connection. The data stays on site.
- The install package carries everything the application needs, so the PC never has to go online, even for setup.
- Operators work in a desktop application. Others who need to look have a read-only view.
- At the client plant it takes its process data automatically from the plant's SCADA system. It only reads that data and sends nothing back to the line. For a new client we can take the data from whatever source they have.
Results
The table compares the version running now with the one it replaced, both ours, on the same changeovers and with the same scoring rule.
| Version | Full recorded period | Blind back-test: production the models never saw |
|---|---|---|
| Current version | +77.3% | +69.8% |
| Previous version | +45.5% | +27.8% |
| Changeovers scored | several hundred | more than a hundred |
What the scorecard measures. It scores forecasts only at changeovers, the moments when a late lab result matters most.
What the percentage means. It is the share of changeover loss that acting on the forecast would have avoided on those recorded changeovers, compared with running without it. 0% means no change, and 100% means no changeover loss at all.
What changeover loss counts. Changeover loss is what the line loses at a changeover, in the period before the first lab result for the new product or settings comes back. The scorecard counts it on the same recorded changeovers twice, once without the forecast and once acting on it.
Where the figures come from. The second column is a blind back-test: scored on production the models were never trained on. The first column covers the whole record, including production they were trained on. Tests on the line have since confirmed the measurements. We share the underlying error figures under NDA. Before you decide anything, you see the error for every measurement on your own data.
Data check. Before training, we compared several million fields in the system's database with the plant's original export files and found 0 mismatches.
Where else this applies
The system has no fixed limit on how many inputs or outputs it handles. What it models is the experience held in a plant's records: what operators and engineers did, and what resulted. The same approach fits other production lines, and operations outside production such as logistics, wherever the decisions and their results are recorded together.
A consumer-goods or packaging line runs many product variants and changes over often. Scrap and rework follow each changeover, and the quality check comes back after the product is already made. That is the gap described at the top of this page. The results on this page come from one line.
The same approach covers other forecasts from recorded data, demand among them. We build the experience held in your records into the model, and at the start we measure how accurate it is on your own history with a blind back-test.
How a project with us starts
You send a past period of your process data and the lab results that go with it. Within one working day we tell you whether a back-test on that record is worth running. The first job is that back-test on your own past production, and it takes one to three weeks. Before we start, its scope and price are set down in writing, and you owe nothing until you have accepted the back-test report. A pilot at the plant, or any larger work, is quoted afterwards from what the back-test showed.
What you receive
- A written back-test report on your own past production.
- The forecast error for each lab measurement.
- The score at your changeovers, on a stretch of the period that was kept blind.
- The result of the field-by-field check of the loaded data against your files.
What to send first
- A short note on what your line records and what the lab measures.
- A sample of the process data for a past period: an export from SCADA or a historian, or the spreadsheets you keep.
- The lab results for the same period.
- If you are a smaller company, the spreadsheets themselves are enough.
If you do not record this data yet, tell us what your line does and what the lab measures, and we will say what to start recording.
The steps
- Data export. Under NDA, you export a past period of process data from SCADA, a historian or your spreadsheets, with the matching lab results. We load it and check it field by field against your files.
- Back-test. We build forecasts for that period, keep a stretch of it blind, and score the forecasts at your changeovers. Nothing is installed at this stage.
- Pilot at the plant. If the back-test holds up, the system is installed at your plant, and its forecasts are compared with lab results as they arrive. Your team decides whether to act on anything it shows.
If you are a smaller company
A first job can be a forecast built from your spreadsheets, for example of demand or of a quality measurement. You send the files. We test a forecast against your past figures and report how close it came.
Ask about a back-test on your data
Send us a note on what your line records and what the lab measures.